Certification
Certificate Number – 39172926
Verification URL – www.goleansixsigma.com/verify

Module 2 – Roles (Belt Descriptions)
White Belt:
- Overall understanding of Lean Six Sigma concepts
- Able to report process issues to yellow, green, and black belts
- Able to use basic Lean Six Sigma vocabulary
Yellow Belt:
- Has basic understanding of Lean Six Sigma concepts
- Can help identify process improvements
- Often work with green and black bels to provide project leadership and training on additional tools.
Green Belt:
- Able to implement Lean Six Sigma
- Responsible for initiating and managing Lean Six Sigma projects within their primary function
- Works closely with black belt practitioners. Trained in similar improvements techniques but with less detail.
Black Belt:
- Usually full-time
- Trains, leads, and supports lean six sigma teams and green belts
- Functions in mu
Master Black Belt:
- Black Belts report to Master Black Belt
- Mentor, coach and lead to black belts in their efforts to support Green Belts
- Works with Executive Management to select projects, align with company strategy, assist removal of barriers to success and identify organization development gaps.
Champion:
- An executive leader who drives the initiatives within an org.
- Provides resources for project teams
- Helps remove barriers beyond team’s control to achieve successful projects.
Module 3 – The 8 wastes of Lean
DOWNTIME is an acronym for the 8 wastes:
- D – Defects
- O – Overproduction
- W – Waiting
- N – Non-Utilized Talent
- T – Transportation
- I – Inventory
- M – Motion
- E – Extra – Processing
4 Things to reduce waste
- Eliminate
- Simplify
- Streamline
- Minimize
Module 4 – 5 Five Phase Method – DMAIC (Duh-Mah-ic)
When NOT to use: DMAIC is a methodology for root cause analysis. DMAIC should NOT be used when the root cause and solution are already known.
When to use: When root cause is not known. When the right solution is not known because the root cause is not known. When the stakes are high and we absolutely need to know the solution will solve the problem. When other methods have been used but failed usually because the root problem is unknown.
DMAIC
D – Define
Define the problem, process, and customer(s) of the process
- Project Charter
- Voice of the Customer
- SIPOC
M – Measure
Develop a baseline measurement to characterize the problem or current state
- Select Measures
- Data Collection Planning
- Operational Definitions
- Baseline Data
A – Analyze
Analyze the process; Collect and analyze casual data to determine the root causes of Defects
- Process Analysis
- Brainstorm Root Causes
- Pareto Charts
- Develop Hypothesis
I – Improve
Develop/implement solutions to remove/reduce sources of problem. Confirm improvement w/ data
- Create Flow
- Mistake-Proofing: Poka-yoke
- Visual Management & 5S
C – Control
Maintain the gains by documenting and monitoring the improved process.
- Process Control Plan
- Monitoring & Response Plan
- Documentation & Storyboard
Module 5 – Define Phase
The main purpose for the DEFINE phase is to get a better understanding of the problem the team is trying to solve.
- To clarify the issue or opportunity being addressed
- To understand who will be involved in the project
- To define the scope of the process being improved
- To consider those impacted and level of effort needed to generate engagement
- To clarify what the customer of the process expects or requires
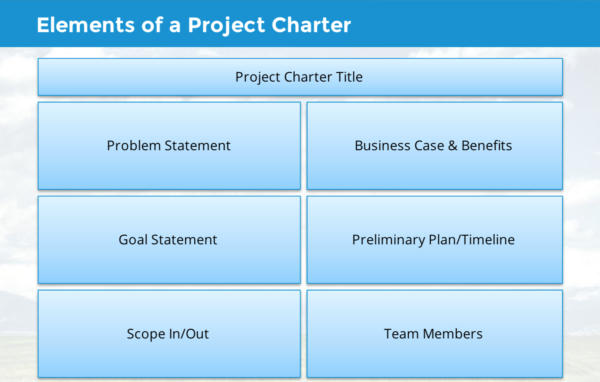
Project Charter
ProjectCharter is a living document that:
- Clearly describes the problem and intended scope of the project
- Clearly defines your plan matches the expectations from senior management.
- Identifies team members and percent of time to be allocated to the project work
- Establishes a timeline for the project
- Serves as a communication vehicle to establish a common understanding of the project among all involved.
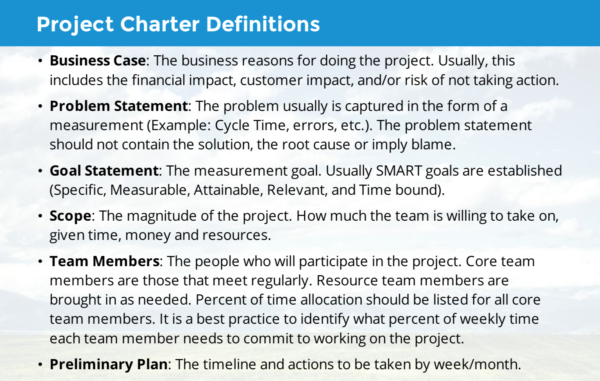
Problem Statement
A problem statement answers the following:
- What is the problem or issue?
- What is the measure you’re trying to impact?
- Example 1 – Since the new travel booking system came online in September (when), usage (what) is only 25% of the forecast (magnitude), measured by the number of bookings complete. Consequently, overall costs are $2 million over budget (impact).
- Example 2 – In the last 3 months (when), we have been receiving customer complaints during peak hours about how long the food is taking to be delivered during lunch time (what). Currently, Cycle Time can take anywhere from 5 – 40 minutes. If this continues, we may lose our business customers who are on a tighter schedule than vacationers (magnitude). We could lose revenue (impact).
Goal Statement
- Defines the expected improvement the team is seeking to accomplish in clear, concise and measurable terms.
- Example 1 – Decrease (verb) defects (what) from the current 35% to 15% (improvement) by end of
1st quarter (completion date) this year.
Voice of the Customer
- The Voice of the Customer (VOC) is your customers’ needs and their perceptions of your product or service
- Customers decide if a product, service or process is effective
- Processes design should focus heavily on Voice of the Customer and customer requirements
- Customer (definition) – The recipients of products and/or services from a specific process.
- Common internal customers are – Human Resources (HR) and Information Technology (IT). Their customers are employees who are internal to their organization.
- External customers – People outside the organization that receive products and services
- Stakeholder (definition) – Anyone who has vested interest in how a process performs buy they do not receive products or services from the process.
SIPOC
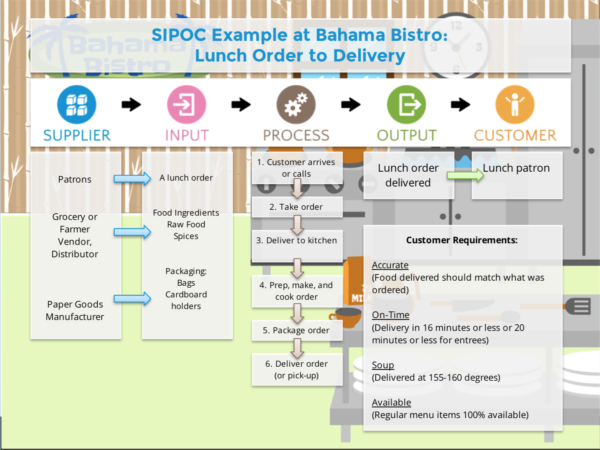
One page High-level map known as a SIPOC. It’s a tool that allows a team to see their process in relation to all needed inputs, outputs, and suppliers.
- Supplier
- Input
- Process
- Output
- Customer
Other Maps
- Process Level Map (Chevron)
- Value Stream Map (VSM)
- Swimlane Map
- Spaghetti Chart
Module 6 – Measure Phase
What’s the purpose of the measure phase?
- To ensure that an issue actually exists and understand what is happening
- To focus our efforts and work
- To set a baseline of how the process is performing today, so we can compare against the measure later and see if an improvement has been made in the improve phase.
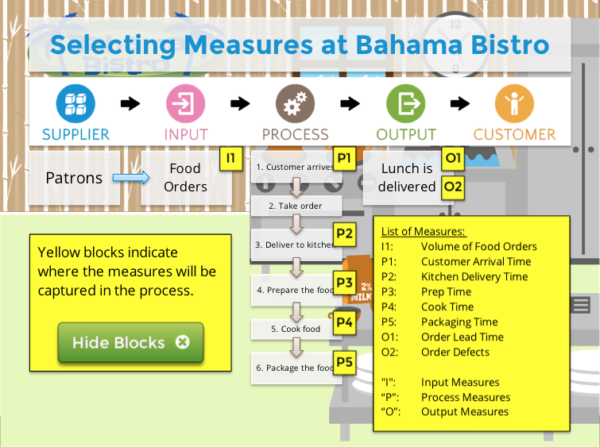
Select Measures
What is a Measure?
- A Measure is a quantified value or characteristic
- Examples:
- Cycle Time (seconds, Minutes, Hours)
- Days (numbers of days)
- Size (Height, width, length)
- Dollars (Revenues, sales profits, costs, overtime)
- Attribute counts (types of loans, gender, products, days of the week)
- Defects Counts (number of errors, complaints, late items)
- Output Measure:
- Measures the outcome of the inputs
- Examples – Customer satisfaction or Lunch Order Cycle Time
- Process Measures:
- All the processes that dictate the output measure
- Examples:
- Customer Satisfaction is made up of:
- Staff courtesy and promptness
- Ease of ordering
- Food quality
- # of Drink refreshes
- Price value
- Lunch Order cycle Time
- Drop Order to kitchen cycle time
- Meal preparation time
- Cook cycle time
- Pick-up from Chef Cycle Time
- Food Order deliver to customer
- Customer Satisfaction is made up of:
Data Collection Planning
It’s important to define the measurements that you want to capture. If not, you’ll end up making the team go back multiple times to gather the data.
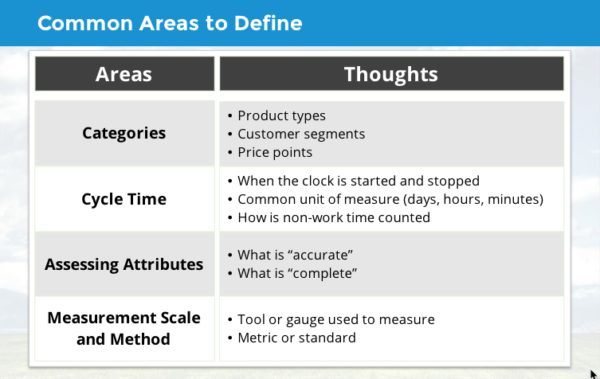
Operational Definitions
Definition – Clearly defining operation terms so that everyone clearly understands what each other means. A clear, understandable description of what’s to be observed and measured, such that different people taking or interpreting the data will do so consistently.
Example (1) – Defining a defect: A defect is any nonconformity in a product or process; it is
Example (2) – Count the dark coffee in the stock room. What is considered dark coffee?
Creating Operational Definitions
- Have a few people write a draft
- Have others test the definition
- Develop a job aid to support the definition
- Have people not involved in the project test the definition, looking for ways it could be misinterpreted
- Finalize the definition and provide training to the people who will collect your data
- Example:
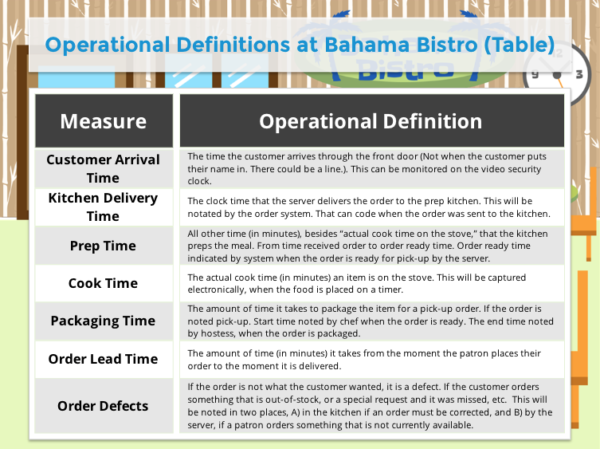
- Order Cycle Time: The time, in minutes, from the moment the customer gives their order to a member of the wait staff, to the moment the plate, glass or bowl is placed in front of the patron.
Baseline Data
Definition – Baseline data is a measurement of the current state of a process. It is an assessment of the capability of the process to meet customer (internal or external) expectations.
Examples:
- It takes an average of 15 minutes from order to delivery of food
- Expedited deliveries cost an average of $3,000 per month
- Customers orders are inaccurate or incomplete 5% of the time
Select the measure(s)

Module 7 – Analyze Phase
Purpose: The Analyze phase is where you find where the issues are and
Why the Analyze Phase?
- Brainstorm root causes, not solutions
- Investigate potential root causes before implementing solutions
- Prove root cause before jumping to implementing solutions
- So that, ultimately, a problem can be solved for good!
Process Analysis
Looking for opportunities in the Process:
- Rework loops

- Redundancies

- Bottlenecks

- Inspections and decisions

- Handoffs

Process Analysis with Swim Lane Chart:

Brainstorm Root Causes

5 Whys and Fishbone Diagram
The 5 Whys is simply asking the question ‘why?’ repeatedly, in order to work the causal chain.

Fishbone Diagram


The head of the fishbone is the (Y) or the output of the problem you are trying to solve.

Pareto Charts

Develop Hypothesis
Definition – A root cause hypothesis is an opinion, theory or guess about what is causing the problem causing the problem to occur


After creating root cause hypothesis’, collect data to verify if your hypothesis’ were correct.
Module 8 – Improve Phase
Create Flow

How to Create Flow
- Batch Size Reduction
- Cross-Training
- Having multiple people trained in many functions creates flexibility to get jobs done efficiently and effectively.
- Parallel Processing

- Standard Work
- Make common procedures and processes easy to perform
- Create effective visual aids,
point of use checklists, templates, job instructions, etc. - The goal is NOT mindless conformity, but saving thought and energy for more important work that people must do.
Other flow tools (Green belt training):
- Changeover
- Single-Piece Flow
- Work Cells
- Workload Balancing
- Demand Leveling
- Kanban Systems
Mistake-Proofing: Poka-yoke
Poka-yoke (definition) – Poka-yoke is a Japanese term that means Mistake-Proofing. Reducing the likelihood of making an error. Ideally, eliminating the opportunity of an error occurring at all
“Hard” Mistake-Proofing: Design processes and tasks for error-free exeuction
- Anticipate errors and make processes “fail-safe”
- Allow preventive actions to be part of
process design - Example (1) – Not being able to start your car without having your key
- Example (2) – When filling out forms, you can’t move on unless you fill out all the required information
“Soft” Mistake-Proofing: Create alarm signals to catch defects as they occur and warn people
- Example (1) – Filling out a form and it gives you a warning that you made a potential error but you can still continue regardless
Visual Management & 5S
Visual Management – When anyone can walk into a workplace and visually understand the current situation. Immediately be able to distinguish normal from abnormal.

The Goals of Visual Management
The ability to identify, at a glance, how well an area is operating to its goals, status of production, and problem-solving effectiveness. Anyone should be able to walk up to any cell/work area and immediately know what is going on and the status of production
5S: Workplace Organization
What is 5s?
- 5S is a way to improve the workspace organization
- A five-step process to create a Leaner and more efficient working environment
- 5S can be done as a stand-alone effort or as part of a larger Lean initiative
- In addition to cleaning and organizing the space, 5S builds in the controls to keep the space neat and efficient.

Sort – The right materials are available and unnecessary materials have been removed
- SORT means remove all items from the workplace that are not needed for current production (or clerical) operations
- Leave only the bare essentials: When in doubt, move it out
- Keep only what is needed, only in the amounts needed, and only when it is needed
- *Red Tag Strategy – Get red tags and tag things that you aren’t sure are needed or not. After tagging them, ask these three questions:
- Is this item needed?
- If it is needed, is it needed in this quantity?
- If it is needed, does it need to be located here?
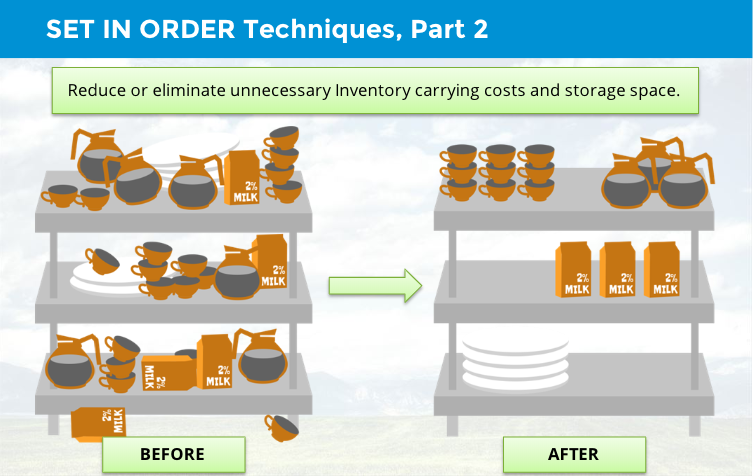
Set in Order – A place for everything and everything in its place
- Arrange needed items by frequency of use and/or location of use
- Dedicate a place for the necessary items in the work area

Shine – Everything is clean and in working order.
- Keep everything swept and clean – remove dirt, grime, and dust from the workplace
- Turn the workplace into a clean place where everyone will enjoy working
- SHINE should not be an annual activity – it should happen on a regular interval (before breaks, daily 5S, etc.)
Standardize – Guidelines and practices to maintain the first three steps
- Formalize the process for keeping the first three S’s maintained (audits, forms, checklists, schedule of responsibilities)
- Develop standards including frequency and responsibilities:
- Who is responsible
- What goes where
- How often to sweep, clean, organize
- What to do if things are not as expected?

Sustain – Ensure 5S becomes a habit that people practice (Daily 5S)
- Management commitment to the system
- Leadership enforcement is the key
- Supervisors must ensure that the. work area meets 5S principles at the end of each day
- Use audits/checklists for monitoring adherence
- Quantify results of workplace inspections
- Prominently display each area’s results
- Hold competition between areas
- Use rewards and recognition
Before you put into place the 5S’s, capture the baseline of what the workspace looked like before.
Module 9 – Control Phase
Why the Control Phase?
- To sustain the improvements made in the process
- To identify a clear plan for maintaining the process
- To assign ownership to monitor and respond to changes in the process that need attention
Process Control Plan
What is a Process Control Plan?
- A Process Control Map and Plan is a visual map fo the process with process measures identified throughout the process
- Process control systems include detailed measurement instruction for monitoring the process
- The Process Control Plan helps to define the process measure target to ensure successful and continuously improving performance.
- Ensures that controls and measurements are in place to maintain long-term success
- Defines what the keys process measures are
- Helps clearly identify where process measures will take place, by whom, and how often
- Helps to ensure that gains will be maintained
- Consists of:
- Map
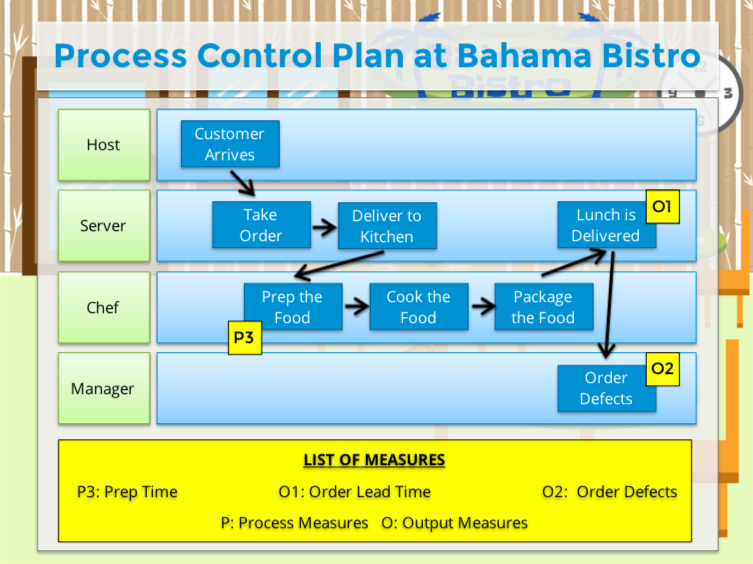
- Monitoring Plan
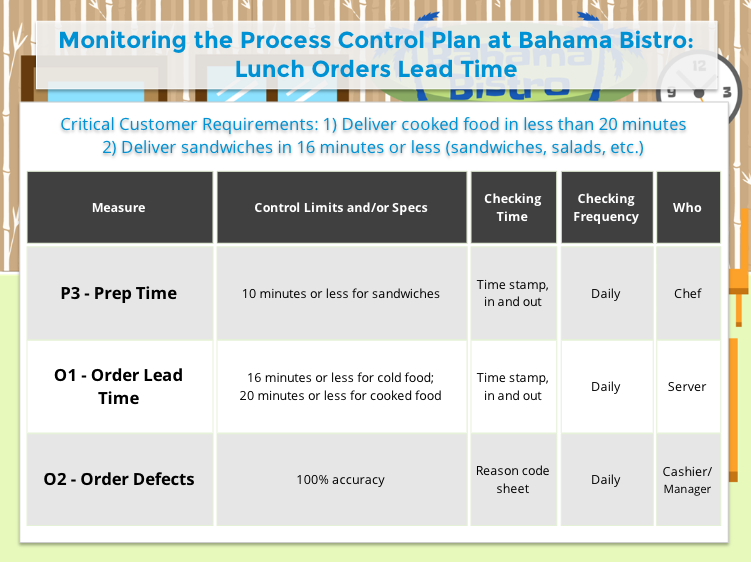
Monitoring & Response Plan
Monitoring Plan – A process to track whether or not the measurement and process stays in control.
- What are the key process measures for this process?
- How and where will the process be monitored for performance?
- How will we continue to monitor the Y measure?
- who will monitor and when?
- What kind fo communication needs to take place and between whom?
- Are there leading or lagging indicator measures that need to be monitored?
Response Plans – A contingency plan if process performance drops
- Examine each key step in the process
- Use Process Maps
- Apply preventative planning:
- What could go wrong?
- How would we respond?
- Who would be responsible?
- What point do we put the Response Plan into action?
- What is the “trigger” level that would warrant a response?
What to include in a response plan?
- Damage Control: Describe potential contingency plans for this failure
- Process Adjustment: What changes might you make to the process to prevent this?
- Effectiveness Assessment: What benchmark(s) must the process achieve to be considered effective?
- Continuous Improvement: What are some potential ideas for future process adjustments? What can be monitored to help detect this problem?

Documentation & Storyboard
Documentation – You want to document the entire process because it helps capture the project methods, successes, and lessons learned. It allows serves as a communication tool to share the project with others.
Storyboard – A storyboard tells the story of your Lean Six Sigma project. It can be a physical document that is posted on a wall or a 20-30 minute Powerpoint presentation.
- Prepare high level project overview
- Include graphs
- Include before and after metrics
- Share lessons learned (The good, bad, and ugly)
Storyboard element
- Executive Summary
- Problem Statement
- Picture of the team
- SIPOC
- Root Cause proof – graphs or maps
- Process Control Systems
- Response Plan

Summary
Define
- Project Charter
- Defining Value: Voice fo the Customer
- High Level Process map: SIPOC
Measure
- Selecting Measures
- Data Collection Planning
- Operations Definitions
- Capturing Baseline Data
Analyze
- Process Analysis
- The 5 Whys and the Fishbone Diagram
- Pareto Charts
- Develop Hypothesis
Improve
- Creating Flow
- Mistake-Proofing: Poka-yoke
- Visual Management and 5S
Control
- Process Control Plan
- Monitoring & Response Plan
- Documentation and Storyboard